Deadlocks: Alerting and Information Collection

Deadlocks can be a serious plague to your existing systems. I am a fan of being proactive whenever possible. So instead of waiting for complaints from users or application developers, and then having to dig through logs and extended events, we can setup some type of alert. I've had clients that did not have any means of knowing when a deadlock was occuring on their server.
How to setup a deadlock alert:
Turning on a few trace flags might be a good idea.
Trace Flag 1205 and 122 can provide process level information among participants of a deadlock.
Trace flag 1204 can return to us deadlock graph node-level information.
You can turn these on with DBCC TRACEON(1205,-1). the -1 indicates that you want to detect it throughout the instance on a glorbal level as opposed to the session.
However, it may be more prudent to also include this in the startup parameters of SQL Server via the SQL Server Configuration Manager. This however, requires a restart of the SQL Service.
You can always utilize this proc:
Once these flags are enabled (by whatever means you choose), you can go ahead create an alert for yourself.
Creating an alert in SSMS is fairly simple. Simply open up the SQL Server Agent -> Right click "Alerts" and create a new alert.

Give it a relevant name and for the error number type in the same number that correlates with the traceflags you enabled earlier.
Repeat this process for the other traceflags.
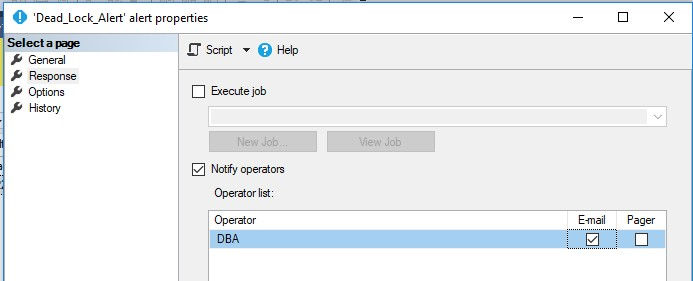
In the "Response" page, you can set to email a previously created operator.

If you want to get fancy you can have it execute a job that shoots you the xml file containing the deadlock graph. But we'll keep this simple.
Once you receive this email alert, you can log into your server and take a look at the "system_health" extended events (or create your own). In SQL 2012 and on has a GUI for extended events.
You can right click on the event_file and view the target data. Filter through for the xml_deadlock report and time stamp that correlates with the alert you received. The "deadlock tab" will provide the graphical information as well as tool tips as you hover over certain parts.

This is just a primer, we can go through the process of automating this even more (like having the alert send us the deadlock graph).
On a final note, this a way to utlize native SQL tools, however having a third party monitoring tool is typically the best solution in my opinion.
